Intelligent styring af vedvarende energi
Hjemmelavet strøm.
Er vedvarende.
Er billigt.
Er uafhængigt.
Er driftsikkert.
Er bæredygtigt.
Er intelligent.
Er vedvarende.
Watts Homegrid™ er dit eget, intelligente og vedvarende energisystem. Vi har samlet de bedste solceller, batterier, ladere og meget mere i en samlet løsning, der er styret og optimeret af kunstig intelligens. Besparelser, bæredygtighed og fuld effektivitet. Helt automatisk.

En helt ny genvej til et grønnere energiforbrug
Intelligent styring
Watts Homegrid™ optimerer og forvalter dit hjems energiproduktion og forbrug helt automatisk. Systemet beregner og planlægger konstant den optimale energiplan baseret på din adfærd, det aktuelle elforbrug, skiftende vejrforhold samt prisudviklingen på det almindelige elnet.
En samlet pakke
Du kan købe solceller alle vegne. Men det er kun hos Watts, at systemet taler sammen: Hjernen sidder i teknikskabet, hvor vores patenterede teknologi sikrer et stabilt og fordelagtigt flow mellem hjemmebatteri og det offentlige net.
Billig og grøn strøm på lager
Vores solceller er perfekte til det skandinaviske klima, men der vil alligevel være dage og perioder, hvor solenergi ikke kan bære hele dit energiforbrug. Derfor sørger Watts Homegrid™ for at købe og lagre den billigste og grønneste energi på forhånd – helt automatisk og ret smart.
Vores produkter
Watts Charger™
Lanceres: 2024
Hurtig, elegant og rent faktisk smart. Watts Charger™ er verdens mindste 3-fasede lader til elbiler. Indstil den til at lade op til et bestemt tidspunkt med brug af vedvarende energi eller lad hurtigt op med billig strøm fra elnettet.
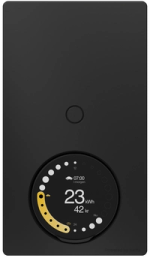
Watts Homegrid Controller™
Lanceres: Forår, 2024
Homegrid Controlleren er en lille men vigtig computer i dit teknikskab. En intelligent algoritme styrer produktion og lagring af energi, forudser dit forbrug og handler almindelig strøm til de bedste priser. Alt sammen helt automatisk.
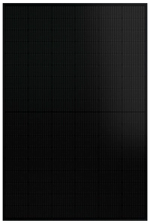
Solceller
Den nyeste teknologi
Watts bruger Winaico-solceller, designet med den nyeste half cell teknologi. Panelets særlige opdeling minimerer effekttabet under energiproduktionen.
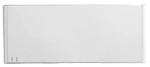
Batteri
Lagring i særklasse
BYD Battery Box er anderkendt som et af markedets med effektive lithiumbatterier. Det er kendetegnet ved lang levetid, maksimal sikkerhed og et robust design.
Styr på forbruget og fremtiden
Watts On™ giver dig overblikket her og nu og ud i fremtiden. Du får komplet indsigt i hele din husstands energiforbrug, mens du samtidig kan se både den aktuelle elpris og præcise prognoser. Flere end 600.000 danskere bruger allerede vores nuværende app til at optimere deres energiforbrug.
Læs mere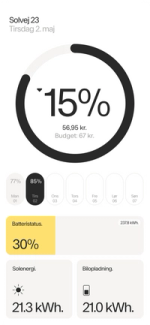
24/7
Følg dit forbrug og optimer dine planer for det kommende forbrug baseret på vores præcise prognoser for de kommende timepriser.
Bliv bedre
Sammenlign dit forbrug med andre. Hvor meget bruger andre husstande på din størrelse? Ligger du over eller under normen? Hvordan kan du blive bedre?
100%
Vi hjælper dig ikke kun med dit elforbrug. Du kan også koble dit varme- og vandforbrug på appen, så du får et samlet overblik og helt styr på budgettet.
"Klimakrisen kræver, at vi alle sammen bruger vores energi mere fornuftigt og bæredygtigt. Men virkeligheden er, at det er for kedeligt og kompliceret at gøre det selv. Derfor vil vi skabe en intelligent og automatiseret energirevolution. For alle."
Hvorfor solceller?
Solenergi er en enestående ressource til ren, billig og hjemmelavet strøm. Med solceller kan du reducere dine årlige eludgifter med op til 70% og reducere dit klimaaftryk betydeligt. Når du har overskydende energi, kan du endda sælge den tilbage til elnettet.
Læs mereSelvforsyning via solenergi
Gør din ejendom selvforsynende. Effektive solceller fra Watts producerer grøn energi, og med vores batteriløsninger har du også mulighed for at gemme overskudsstrøm fra solcellerne til de timer, hvor strømprisen er høj eller hvor vejret ikke er med dig.
Større uafhængighed fra elnettet
Når du producerer din egen strøm, er du ikke længere så afhængig af elnettet. Det sikrer dig mod svingende elpriser og giver dig mulighed for at planlægge og styre dit forbrug, så du får det bedste ud af din egen strøm.
Markante besparelser på din elregning
Den energi du laver med dine solceller er hjemmelavet. Derfor er den også billigere. Med solceller fra Watts kan du producere og lagre store mængder energi, mens du over tid kan afskrive dit anlæg. Det betyder, at du vil få færre og færre udgifter til energi.
Intelligent styring gør forskellen
Der er masser af besparelser i kroner og CO2 at hente på selv de mindste og løbende justeringer. Men det er både teknisk, tidskrævende (og kedeligt) at gøre selv. Watts Homegrid™ tager sig af det hele, så du kan tage dig af noget andet.
Gør en betydelig forskel for klimaet
Med en investering i et solcellesystem gør du en helt afgørende og personlig forskel for klimaet, fordi det er et klimavenligt og driftsikkert alternativ til de traditionelle energikilder. Vi tilbyder også de mest bæredygtige produkter og teknologier, så du får det mindst mulige CO2-aftryk.
Øget markedsværdi af din bolig
Solcelleanlæg er fremtiden — både for klimaet og din bolig. Når du bliver selvforsynende, står du med en bolig, der i princippet kan producere næsten gratis energi. Det er en markant økonomisk fordel, der vil øge markedsværdien af din ejendom.
Vi er med dig hele vejen
Vi tager os af det hele: Rådgivning, installation og service og al den hjælp du skal bruge, for at dit system kører optimalt og helt af sig selv.
Læs mereVejledning og tilbud
Vi vejleder dig til at vælge den helt rigtige energiløsning, der specifikt vil dække netop din ejendoms strømforbrug og eventuelle behov for særlige installationer til varmepumpe, ladere eller særlige løsninger.
1
Teknikerbesøg
Vores tekniker besøger dig og kontrollerer, at den valgte løsning er den mest velegnede til din ejendom. Teknikeren gennemgår derefter de næste skridt, alle detaljerne og udarbejder en kontrakt.
2
Køb og montering
Vi aftaler et passende tidspunkt for installationen, hvorefter din energiløsning vil blive elegant monteret af vores erfarne installatører — så hurtigt som muligt.
3
Intelligent energiløsning
Du er nu klar til at opleve fordelene ved en intelligent og vedvarende energiløsning: Lavere elregninger, mindre CO2 og fuld kontrol. Helt automatisk.
4
Kom i gang
Få intelligent styring af din egen vedvarende energi. Det hele starter med et uforpligtende tilbud fra én af vores rådgivere.
Ofte stillede spørgsmål
Hvad koster det at få solceller?
Gennemsnitsprisen på køb af solcelleanlæg og installation ligger på ca. 70.000-120.000 kr. for et parcelhus med et årligt elforbrug på ca. 4.000 kWh. Du skal dog være opmærksom på, at prisen kan svinge alt efter anlæggets størrelse, effektivitet og type.
Et solcelleanlæg på 6 kW har en årlig produktion på ca. 5.800 til 6.000 kWh pr. år. Det kan dække en gennemsnitlig husstands årlige energiforbrug og potentielt også være i stand til at sælge den overskydende strøm.
Hvis du skal bruge et mere præcist estimat, så vil vi meget gerne tale med dig om en løsning tilpasset netop dit hjem. Du kan kontakte os lige her.
Er solceller miljøvenlige?
Det kræver energi og materialer at producere et solcellepanel, men man anslår at et solcellepanel er energimæssigt tjent hjem efter 2-3 år. I dag indgår vedvarende energi oftest til produktion af solcellepanelerne, men den præcise belastning afhænger af producenten og kan være svær at anslå helt præcist.
Ligeledes indgår transporten af solcellepanelerne typisk fra Asien til Europa også i energiomkostningen. I solcellepanelets levetid (ca. 25-35 år) vil solcellepanelet producere 100% grøn strøm, og når solcellepanelets levetid er slut, vil det blive genanvendt.
I dag kan ca. 90% af solcellepanelet genanvendes, og vi må antage, at der i takt med udbredelsen af flere og flere solceller i verden vil blive optimeret på denne proces, så endnu flere af panelernes materialer får nyt liv. Derfor tør vi godt sige, at solceller er en miljøvenlig investering og den bedst mulige vedvarende energiløsning.
Hvor effektive er solceller?
I Danmark har solcellerne som regel den største effektivitet i de lyse sommermåneder. I den periode vil de være i stand til at omsætte ca. 20% af solens energi til elektricitet. Effektiviteten er i høj grad påvirket af placering og vinkling. Den største effektivitet kan typisk opnås med sydvendte paneler på 45 grader.
Vi anbefaler, at du forhører dig hos vores solcellespecialister i forhold til den bedste placering af solceller for netop din bolig. Du kan kontakte os lige her.
Er min bolig egnet til solceller?
Det er vigtigt, at du får undersøgt af en certificeret instans om dit tag kan bære solcellerne og hvor stort et område, du skal afsætte til at dække dit energibehov. Du kan også overveje at montere solceller på husets facade eller stativer på jorden.
I Danmark vil den mest optimale placering af solcellerne være direkte mod syd med en hældning på 45 grader. På den måde kan du producere mellem 900 til 5000 kWh om året. Det hele afhænger naturligvis af anlæggets størrelse, omgivelserne, skygger på anlægget og vejrforhold.
Solceller kan i enkelte tilfælde være for tunge til boligens tag. Derfor er det vigtigt at undersøge, om der er behov for at understøtte taget yderligere. Før du køber solceller bør du kontakte din kommune, for at få viden om hvorvidt lokalplaner, fredninger og om servitutter tillader dig at sætte solceller på din bolig.